

Most traders look at one number on their statement: the balance. It tells you where you ended up, but not how you got there, what it cost, or whether the result is likely to repeat. Everything else on the statement is there to answer those questions.
This guide explains how to read a trading statement line by line: what each section and column means, where your costs are hiding, and which of the many figures at the bottom actually tell you something about your trading.
Key takeaways
• A statement is your account’s official record: every trade, every deposit and withdrawal, and every charge.
• Each closed trade shows its own commission and swap. The spread never appears as a line, because it is built into the prices.
• Balance counts closed trades only. Equity includes open positions, so it is the truer picture.
• Net profit, profit factor, expected payoff, and maximum drawdown tell you more than win rate or your best trade.
• A short monthly review of your statement is one of the most useful habits a trader can build.
What is a trading statement?
A trading statement is the official record of activity on your trading account over a period. It lists every closed and open position, every deposit and withdrawal, and every charge such as commission and swap, then summarizes the account’s balance, equity, and overall trading results.
Where to find your statement in MT5
In the MetaTrader 5 desktop terminal, open the History tab in the Toolbox at the bottom of the screen, choose the period you want, then right-click and select Report. You can save the report as an HTML page or a spreadsheet. The layout described below follows this report. If you also receive statements by email, they use the same building blocks.
One detail to know before you read anything: times on the statement are in server time, which may not match your local time. A trade you opened in the evening can appear under the next day.
The header: whose account, which period
The top of the statement shows the account holder’s name, the account number, the company, the account currency, and the date range covered. Check these first. A statement for the wrong account or the wrong period makes every number below it meaningless, and the account currency tells you what all the money figures are measured in.
Closed positions: one line per trade
Reading a single line
Each closed trade takes one row. Here is an illustrative example of a buy trade on EUR/USD, and what each column means:
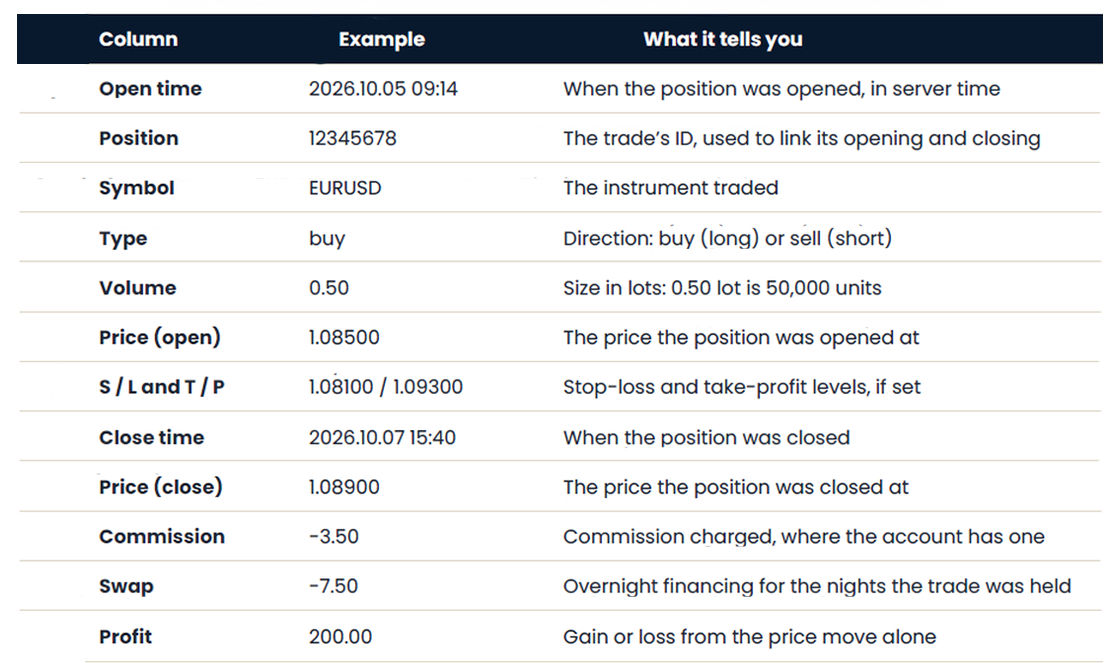
Notice that the Profit column covers the price move only: 40 pips at $5 a pip on 0.50 lot is $200. What the trade actually added to the account is profit plus commission plus swap: $200 minus $3.50 minus $7.50, or $189. Reading the profit column alone overstates every winner and understates every loser.
Positions, orders and deals
The report can show the same activity in three ways, and knowing the difference saves a lot of confusion:
• Orders are instructions you gave: buy, sell, or a pending order. An order can be cancelled without anything happening.
• Deals are what actually executed. A complete trade normally has at least two deals: one marked “in” that opens it and one marked “out” that closes it. Partial closes create extra deals.
• Positions combine the deals into one row per trade. This is usually the easiest view for reviewing your results.
Money in and money out
Deposits and withdrawals appear as balance operations, usually with a short comment, rather than as trades. Check that every one matches your own records and your bank or payment statements. This is also where you separate performance from funding: an account that grew from $2,000 to $3,000 because you deposited $1,000 has not made any money.
Some statements also show a credit line. Credit is not part of your balance and cannot be withdrawn as cash, so leave it out when you judge your own results.
The account summary: balance, equity and margin
Near the end, the statement summarizes the account as it stood at the close of the period. Using illustrative figures:
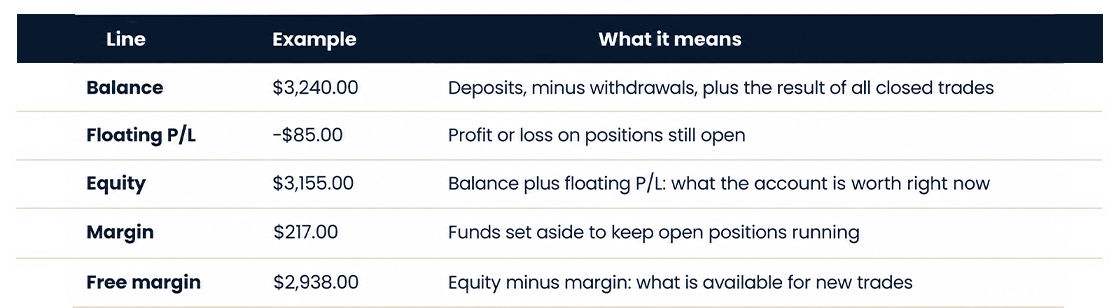
If you only remember one line, make it equity. Balance ignores open trades, so a balance that looks healthy can hide a large open loss. For more on how margin is calculated, see our guide to how leverage and margin work.
The results section: which numbers actually tell you something
The bottom of the report lists a long set of statistics. Some are genuinely useful; some sound impressive and say very little. Here is how to sort them.
Numbers worth your attention
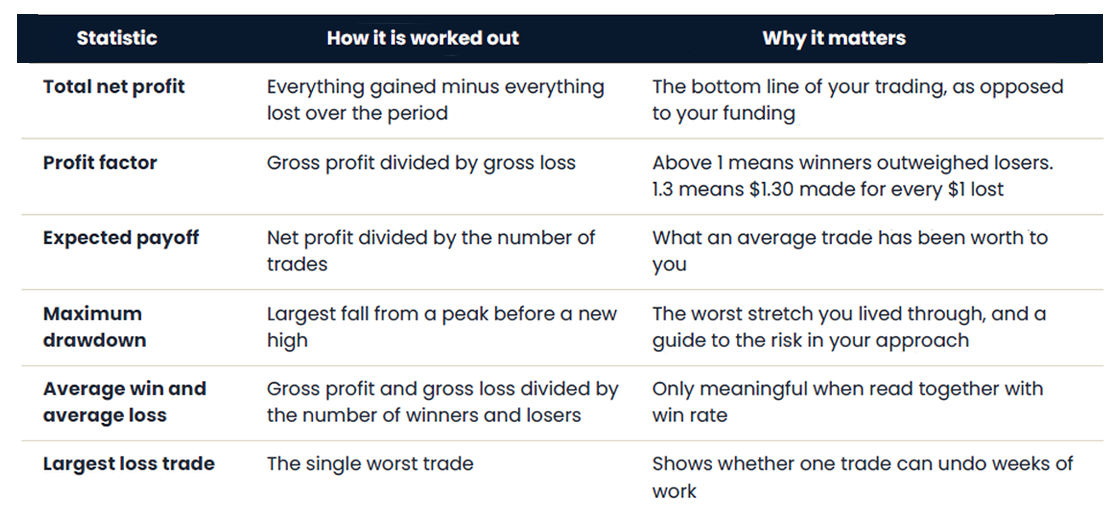
Drawdown usually appears twice. Balance drawdown counts closed trades only. Equity drawdown includes losses on open positions along the way, so it is normally larger and closer to what you actually experienced.
Why win rate alone misleads
Win rate is the most quoted number and one of the least useful on its own. Compare two illustrative traders over 100 trades:
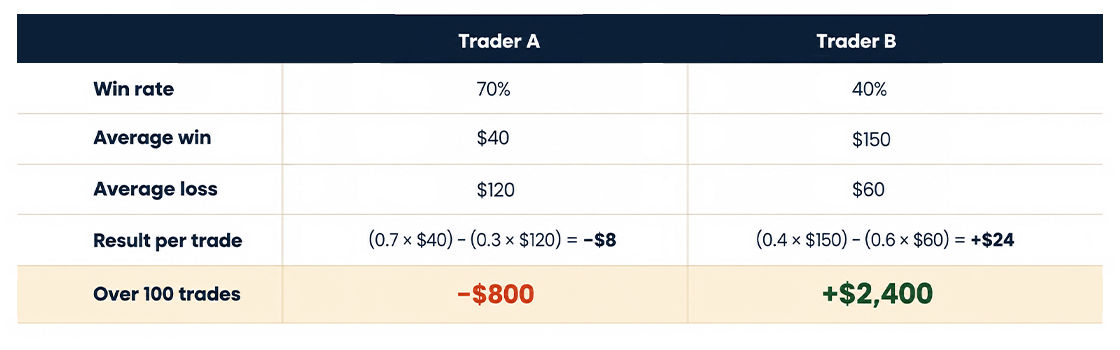
Trader A wins most of the time and still loses money because the losses are three times the size of the wins. Trader B loses more often than not and comes out well ahead. Always read the win rate next to the average win and average loss.
Numbers to treat with care
• Gross profit on its own: it ignores every losing trade.
• Largest profit trade: one good trade says little about the next hundred.
• Consecutive wins: a streak is not a strategy.
• Ratios such as the Sharpe ratio or recovery factor on a small number of trades: with only a few dozen trades, they can swing widely on a single result.
Sample size matters for every statistic here. Twenty trades can show almost anything. Judge an approach over a meaningful number of trades, not a lucky or unlucky week.
Find your real costs
Add up the Commission and Swap columns for the period, plus the Fee column, which appears in the Deals view. That total is your direct trading cost, and it is worth comparing with your gross profit: if costs take a large share of what your winners make, your trade size, holding period, or account type may need a second look.
One cost will never appear as a line: the spread. You pay it through the prices themselves, because you buy at the higher ask and sell at the lower bid, so it is already inside the open and close prices and therefore inside the profit column. Our guide to spreads, swaps, and fees shows how to calculate it. To compare the pricing of each account type, see the Accounts page.
A monthly statement review
Ten minutes once a month is enough. Pull the report for the month and work through these steps:
1. Check the header: right account, right period, right currency.
2. Match every deposit and withdrawal against your own records.
3. Note total net profit, which reflects trading only. If you compare balances instead, take deposits and withdrawals out first.
4. Add up commission, fees, and swaps, and compare the total with your gross profit.
5. Read the profit factor and expected payoff, and compare them with last month.
6. Check maximum drawdown and your largest loss against the risk you planned to take.
7. Look at win rate only alongside average win and average loss.
A statement is not just a receipt. Read properly: a forex trading statement is the most honest feedback a trader gets: it shows what you actually did, what it cost, and whether your approach is working. The numbers are already there each month. The habit is what makes them useful.